Service Design · Public Health
Voice-first tablet survey for rural Appalachia.




- Survey completion rate
- 89%Survey completion rate
- Reduction in data errors
- 97%Reduction in data errors
- Faster onboarding per household
- 20×Faster onboarding per household
Context
A decades-long NIH-funded health study in Appalachia was losing participants faster than it could replace them, and with them, its data and its funding.
The research itself was sound. What was collapsing was the pipeline feeding it. Paper surveys came back riddled with errors. Participants couldn't parse 120+ dense academic questions. Families who waited all day for promised dental care left without it.
Participants carried low digital and health literacy, dense academic language they couldn't decode, and years of institutional mistrust.
My role: design lead, from field research to in-clinic testing. I worked with research teams at Pitt and WVU, clinicians, developers, and community partners. The community partners weren't stakeholders to manage. They were the reason any of it worked, because in this setting trust ran through them, not through the tool.
The study wasn't failing on science. It was failing on data and trust.
Objective
Protect a study that still produced usable data. Participants needed three things:
- To understand what was being asked: simple, spoken language.
- To answer without reading or writing: voice-first, not form-first.
- To actually receive the care they were promised for showing up.
Researchers and clinicians needed accurate, transferable data without losing hours to manual onboarding. All of it had to work in the field, not the lab:
- Low reading fluency. Nothing could depend on a participant reading or writing.
- No reliable connectivity. The system had to run offline and sync later.
- Fragile trust. One more broken promise and participation would not come back.
Approach
1. A 120+ question survey became a spoken conversation
Working alongside the research team, I ran the survey question by question, and together we reworked each one into a plain-language sound bite a participant could take in the first time they heard it. My job was the translation and the interaction; theirs was guarding what each item was scientifically there to measure. Then it all moved onto tablet-based voice prompts people could listen to and answer out loud. The tablets worked offline and uploaded to a shared database at the end of each day, whenever the clinical lead had wifi.
| Original | Rewrite |
|---|---|
| "Is there any known consanguinity?" | "Are the child's parents related by blood?" |
| "Most people do not realize the extent to which their illnesses are controlled by accidental happenings." | "Getting sick is mostly a matter of chance, not something you control." |
| "I know someone I would feel perfectly comfortable talking to about problems budgeting my time between school and my social life." | "When balancing school and friends gets hard, I have someone I'm comfortable talking to." |
The discipline wasn't making the words shorter. It was preserving exactly what each validated question measured while making it answerable by someone who couldn't parse the original. That is where the design lived.
2. Auto-generated family trees gave clinicians their hours back
On site, I found clinicians losing hours of every clinic day to hand-collecting family names and drawing three-level family trees, about 20 minutes for every household. I reengineered the flow so the user could self-select family household members from a list and the system generated the pedigree. That reduced wait times and allowed clinical staff to focus on checking in families.
3. Trust was a systems problem, so we fixed the care promise
Dental needs were severe, and families kept leaving without care after waiting all day. No interface change fixes that, and it wasn't a decision I owned. What I could do was put it in front of the directors in their terms: every family turned away was participation and data walking out the door.
Together we landed on a dedicated overflow dental team to absorb emergencies in parallel, so urgent cases were always covered without disrupting the scheduled flow. After that, people got care every time they showed up. Trust recovered, and participation followed it.
Outcomes & Impact
- Participation, data quality, and trust recovered enough to keep the study and its NIH funding viable.
- The survey became usable for the population it was meant to reach.
- Onboarding dropped from 20 minutes to 1 minute per household, taking hours off a clinic day and freeing clinicians for clinical work.
- Data was available to all institutions within 12 hours instead of a week.
- Attendance recovered once families got care every time they showed up.
- The model is now being looked at for replication at other underserved sites.
- Survey completion rate
- 89%Survey completion rateTablet surveys completed vs. paper surveys, where participants straightlined
- Reduction in data errors
- 97%Reduction in data errorsTablet entries vs. paper surveys transcribed by hand.
- Faster onboarding per household
- 20×Faster onboarding per household20 minutes down to 1 minute. Auto-generated pedigrees replaced hand-drawn three-level family trees
Reflection
Map the whole service first, before you touch a screen
I didn't discover the onboarding bottleneck until I was standing in a clinic watching clinicians hand-draw family trees. If I had blueprinted the entire service up front, the participant journey, the staff workflows, and every handoff between them, I would have seen the manual pedigree work and the care-delivery gap on day one. I've learned to look at the entire system first.
How I'd build this today
A language model can now draft the plain-language rewrites in seconds, but left alone it will simplify an item into something that no longer measures what it's supposed to. So the real work becomes the guardrail: the model proposes, the researchers confirm construct validity, and nothing ships without that check.
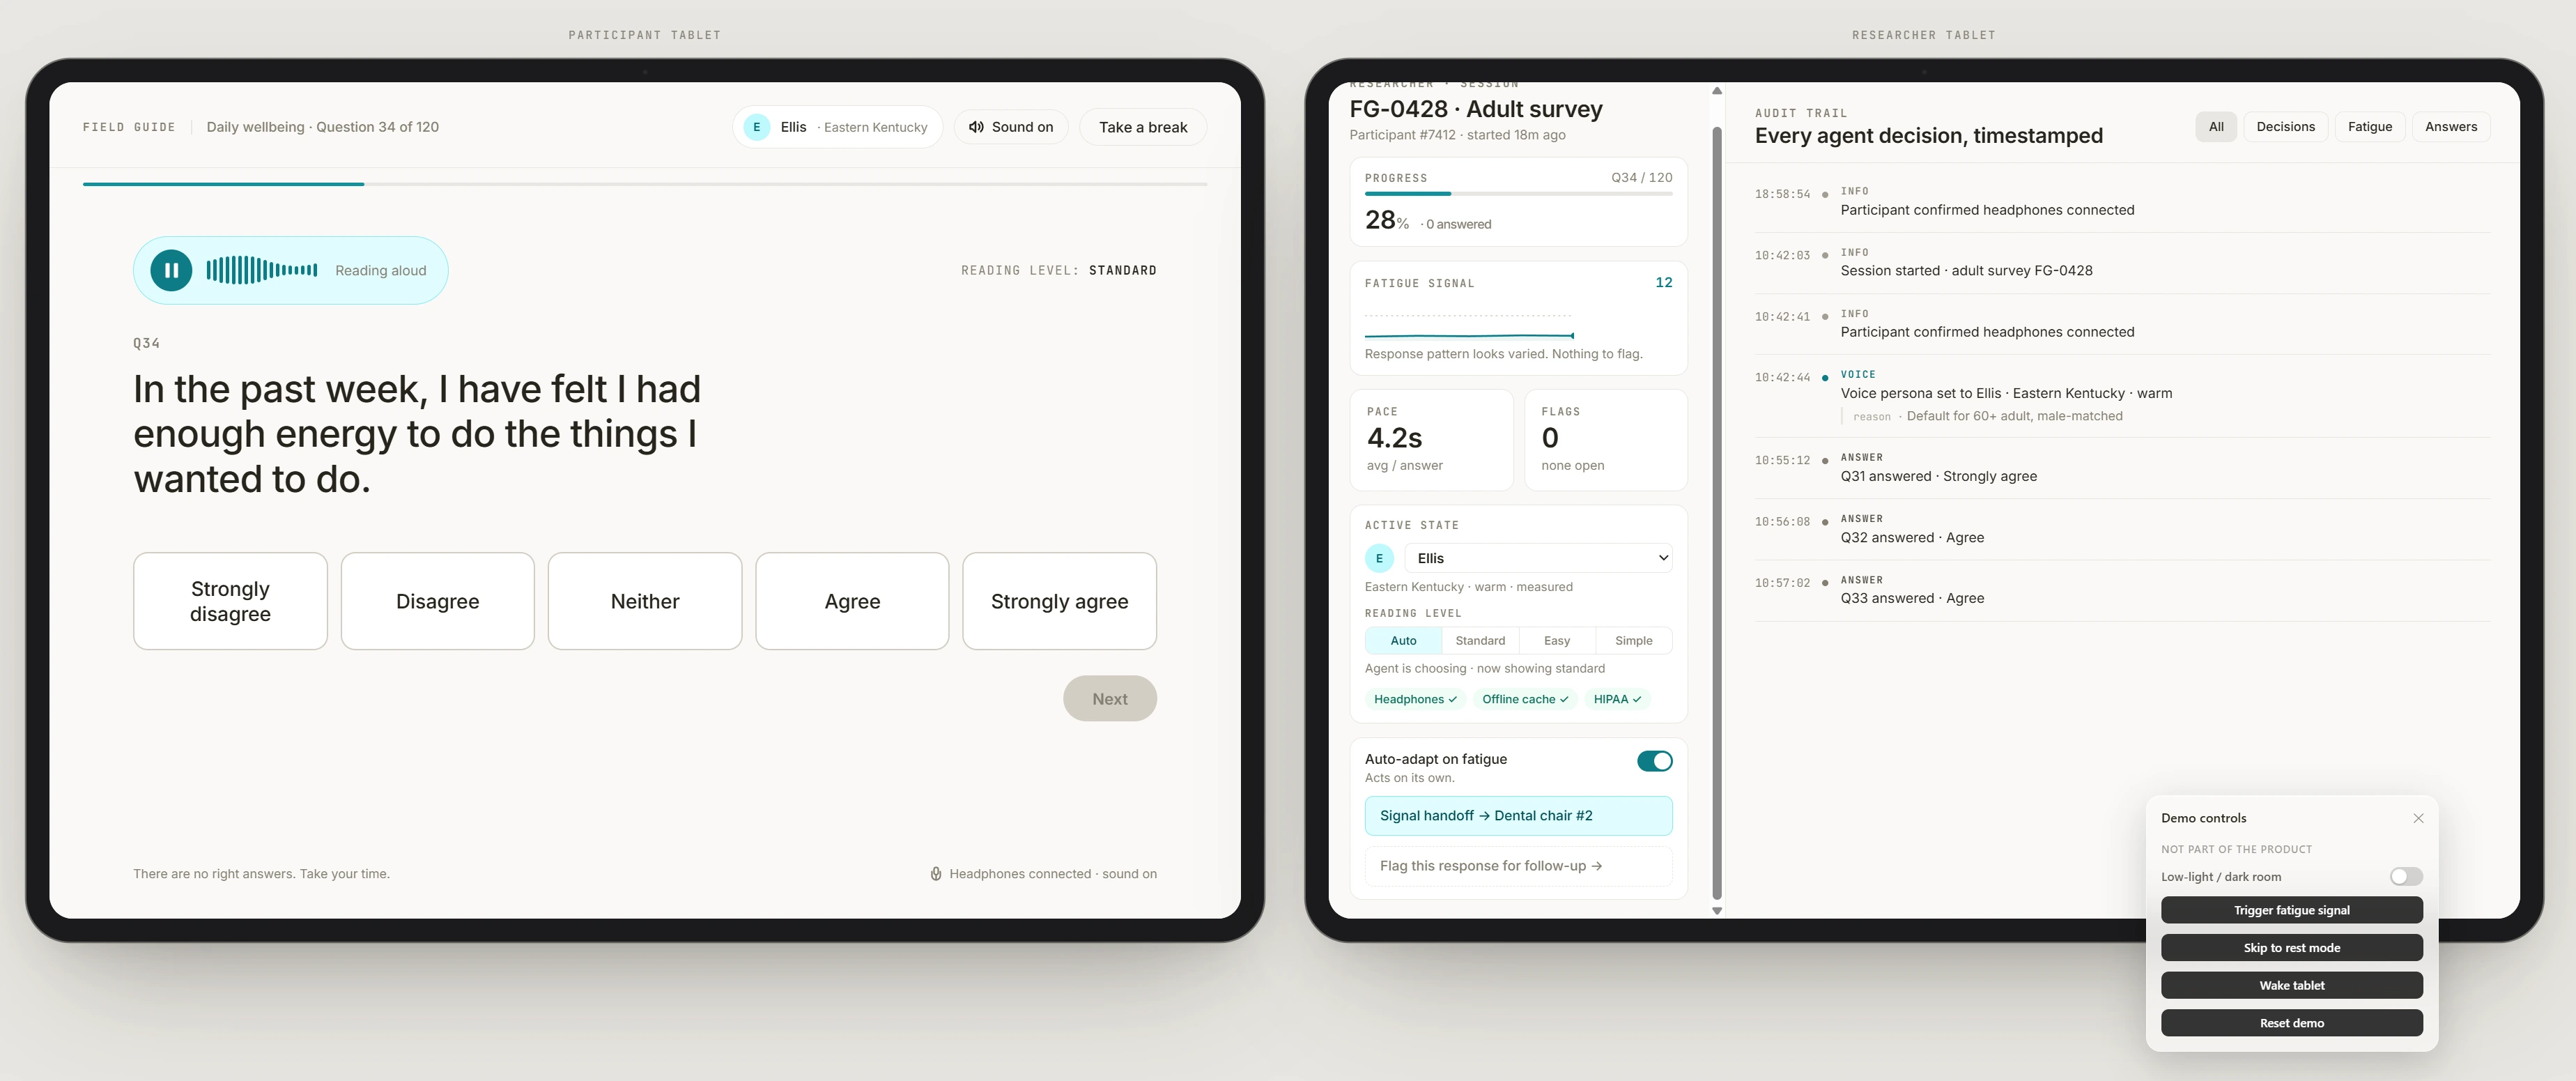
From there the survey becomes adaptive: fatigue detection that slows down or pauses when attention drops, regional voice personas so the system sounds local, and still offline-first, because the connectivity problem hasn't gone anywhere.
The goal was never to automate the interview. It was to make research feel human to people the system usually fails.